INSTRUCTIONS FOR

Using the Online

MAPPING TOOL

The following instructions will help you make full use of the online mapping tool that has been developed in support of pastorate planning efforts. Additional tutorials can be found using the mapping tool’s Info (Help) button in the upper right-hand corner of the screen.

Most likely, you will want to start by locating your parish. To do so, use the search box in the upper left corner and enter your parish name.

Hint: If your parish name does not come up automatically as a choice, you may want to try typing in “Saint” instead of “St.” Also, make sure you are entering the full name of the church (for instance, “Church of the Immaculate Conception,” instead of “Immaculate Conception.”

A few data layers already are displayed by default, including parish and pastorate boundaries, the location of active worship sites and Catholic schools, County boundaries, and roads.

WHAT DATA IS AND IS NOT AVAILABLE IN MAPDASH?

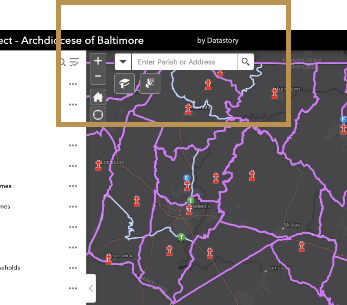
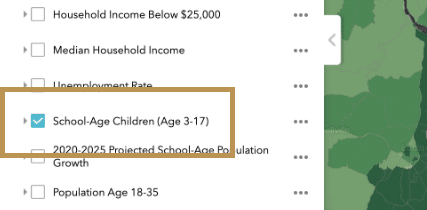
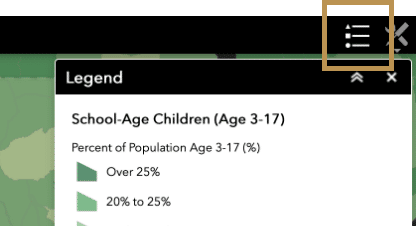
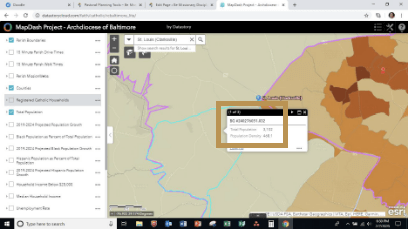
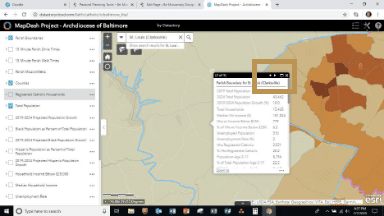
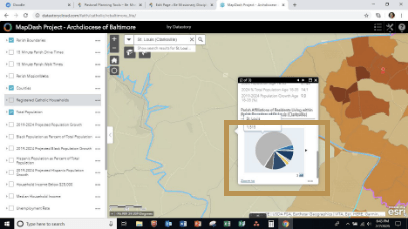
Most of the data available on the public-access version of MapDash draws from Census data for existing and projected populations, though some draw from Archdiocesan data. These data layers either contain point data (such as the location of an individual worship site), Census block group data (for instance, Projected Population Growth), or calculated data (including walk and drive times from worship sites).

The Archdiocese of Baltimore Office of Pastoral Planning has access to additional data that is not publically available. This includes data related to parishioner households, household characteristics and market data, etc. If you are looking for this type of information, please contact the Office of Pastoral Planning for assistance.

HOW DO I ADD INFORMATION LAYERS TO THE MAP?

You can add data layers to the map to understand the different demographic trends occurring in your parish and region. These layers can be turned on and off. Layers that contain points and large geographic areas can be viewed at the same time together. For instance, Schools (points) can be viewed at the same time as the School-Age Children layer (which covers large geographic areas) to assess the relationship between the two. However, turning on two geographic layers will make it difficult to “read” either one well.

TO ADD AN INFORMATION LAYER:

1. Select the data layer from the menu on the left-hand side of the screen that you wish to view. In the image, the School-Age Children layer has been turned on.

2. To view the corresponding Legend, select the Legend icon from the upper right-hand corner.

3. Unclick the arrows and boxes to deactivate these features.

HOW DO I VIEW THE SPECIFIC DATA FOR A PARISH OR BLOCK GROUP?

When you click anywhere on the map, a pop-up box will appear that give you the tabular data for that parish, pastorate, and/or active data layer. You may need to scroll through the “pages” on the pop-up box to see all of the data, however.

To view all available data:

  1. Click on an area of the map
  2. A pop-up box will appear that shows the data for the parish within which you clicked and the pastorate within which you clicked. If you have any additional data layers activated, it also will show the data for any layers that overlap the place where you clicked.
    To view all of these “pages” in the pop-up box, use the arrow in the upper right-hand corner to scroll through them.
  3. Be sure to scroll to the bottom of the pop-up box when you are on the parish data and pastorate data pages. There you will see a series of pie charts of data related whichever page you are on (parish or pastorate). On the parish data page, you will see pie charts for:
    a. Parish affiliations of residents living within the parish boundary;
    b. Residential population in the parish boundary by race; and,
    c. Residential population in the parish boundary by age.

The pastorate data page only contains pie charts for race and age breakdowns within the pastorate boundary.
To view all of these pie charts, use the arrow to the right or left to scroll through them.

An example follows…………

In this example, the Total Population layer has been turned on, in addition to the default layers.

When an area within the St. Louis parish boundary is clicked, the pop-up box displays the population data for the Census block group that was clicked (which is highlighted in blue).

Using the arrow in the upper right-hand corner will scroll through additional “pages” of data for the parish and, since it is in a pastorate with St. Francis of Assisi, for the whole pastorate, as shown below.

Scrolling to the bottom of the parish or pastorate data pages will show the pie-chart demographic data. Hovering over the pieces of the pie will reveal the data for each.

View the Map

Ready to get started? Enter MapDash for a fully interactive experience and start learning about your parish, the surrounding area, and our archdiocese as a whole.